A just about right scale (JAR scale) is a bipolar labelled attribute scale with a midpoint anchored with ‘just-about-right (JAR)’ or two semantically opposite anchors such as ‘too strong’ and ‘too weak’. The just-about-right (JAR) scale combined with a hedonic scale is commonly used in acceptance and preference tests to measure the appropriateness level of an attribute and to test consumer preference and acceptability of foods.
Use this guide alongside our product experience collection and our sensory test design checklist to structure attribute adequacy scales, calculate mean drop and weighted penalties, and separate actionable formulation defects from non-penalizing perceptual shifts.
How a Just-About-Right Scale Pairs with Overall Liking
A common five-point just-about-right scale in product evaluation labels categories from ‘Much too strong’ and ‘Somewhat too strong’ through ‘Just-about-right’ to ‘Somewhat too weak’ and ‘Much too weak’, while other versions employ three or seven response categories with the middle category labeled just-about-right. In a 5-point Just-About-Right (JAR) scale consisting of ‘much too low’, ‘slightly too low’, ‘just-about-right’, ‘slightly too high’, and ‘much too high’, responses are grouped for statistical analysis into three categories: ‘too low’ (scores 1–2), ‘JAR’ (score 3), and ‘too high’ (scores 4–5). On a three-category JAR scale (‘too low’, ‘just-about-right’, or ‘too high’), the central JAR category represents the perceived ideal level of the attribute, whereas the two non-JAR categories indicate deviations below or above that level. In a 3-point Just-About-Right scale used for meatball evaluation, the response categories are coded as 1 = not enough, 2 = just about right, and 3 = too much.
Overall liking was evaluated using a 9-point hedonic scale ranging from 1 = ‘dislike extremely’ to 9 = ‘like extremely’. On a 7-point hedonic scale evaluating overall liking, panellists rate each sample as 1 = dislike very much, 2 = dislike moderately, 3 = dislike slightly, 4 = neither like nor dislike, 5 = like slightly, 6 = like moderately, and 7 = like very much.
Quick Reference: JAR Scale Formats, Liking Pairings, and Decision Thresholds
| Diagnostic Parameter | Scale Structure or Formula | Operational Decision Rule |
|---|---|---|
| 5-point JAR scale collapsing | Scores 1–2 grouped as 'too low', score 3 as 'JAR', and scores 4–5 as 'too high' | Consolidate five response levels into three directional groups before penalty calculation. |
| 3-point JAR scale coding | 1 = not enough, 2 = just about right, and 3 = too much | |
| 9-point overall liking scale | 1 = 'dislike extremely' to 9 = 'like extremely' | |
| Dual-threshold relevance rule | At least 20% of consumers and mean drop greater than 1 liking point | Flag a non-JAR direction as hedonically relevant when both criteria are met. |
| Total Penalty thresholds (1 to 9 scale) | Not-JAR responses >= 20% (override 5%); total penalty > 0.50 high and > 0.25 noteworthy | Prioritize attributes whose weighted penalty exceeds 0.50 on a 9-point liking scale. |
Penalty Analysis and Mean Drop Calculation Step by Step
Penalty analysis (PA) of 5-point JAR data consists of 3 steps: (1) collapsing the 5-point JAR scale into 3 groups (too low, JAR, and too high), (2) calculating the percentage of consumers and the mean overall liking score for each group, and (3) calculating the mean drop by subtracting the mean overall liking score for the JAR group from the mean overall liking score of the ‘too high’ or ‘too low’ groups. In penalty analysis (mean drop), the mean drop equation is calculated as [a mean liking score of the JAR group—a mean liking score of the non-JAR group]. ASTM International manual MNL63 is titled ‘Just-About-Right (JAR) Scales: Design, Usage, Benefits and Risks’ (edited by Rothman and Parker, 2009), and its Appendix L by Schraidt (pages 50–53) covers ‘Penalty Analysis or Mean Drop Analysis’.
Direction-Specific Weighted Penalty (Total Penalty Score)
Direction-specific weighted penalties (reported as Total Penalty Scores) are calculated as weighted penalty = p(non-JAR) × mean drop, where p(non-JAR) is the proportion of consumers selecting the corresponding non-JAR response, and are interpreted descriptively as prioritization indices rather than as tests of statistical significance. In SIMS sensory software (mathematical specifications per Tom Carr, 2007), the non-JAR panelist percentages are JAR(NE%) = N of JAR’s(NE) / Total JAR’s N and JAR(TM%) = N of JAR’s(TM) / Total JAR’s N, and when JAR(NE%) >= 20% or JAR(TM%) >= 20%, Total Penalty = Mean Drop X JAR(NE%) or Mean Drop X JAR(TM%). In SIMS Penalty Analysis, JAR scales must be Hedonic attribute types with an odd number of categories (middle category assumed to be JAR), actual Not-JAR responses must be >= 20% in either direction (NE or TM) with a rarely used override to 5%, and on a typical 9pt Overall Liking scale (1 to 9 return values) a total penalty > 0.50 is high and > 0.25 is noteworthy.
One-Dimensional and Multi-Dimensional Regression Models in SensoMineR
In the R package SensoMineR, the JAR(x, col.p, col.j, col.pref, jarlevel=‘jar’) function constructs two penalty analysis regression models: a one-dimensional model (Hedonic score = Descriptor_j_Not enough+ Descriptor_j_Too much) and a multi-dimensional model across all descriptors simultaneously (Hedonic score = Descriptor_1_Not enough+ Descriptor_1_Too much +…+ Descriptor_p_Not enough+ Descriptor_p_Too much+ Product + Judge). In SensoMineR version 1.27, the JAR() procedure returns a list of 3 objects: penalty1 (one-dimensional penalty coefficient, standard deviation, and p-value testing difference from 0), penalty2 (multi-dimensional penalty coefficient, standard deviation, and p-value), and Frequency (percentage of times non-jar categories are given for each product). In SensoMineR, plot.JAR uses the signature plot(x, name.prod, model=1, confidence=TRUE, level=0.05) to plot penalty against the frequency of categories, where model=1 draws one-dimensional penalties, model=2 draws multidimensional penalties, confidence=TRUE draws confidence intervals, and level=0.05 sets the category selection threshold.
Worked Calculation Examples: Mean Drop, Weighted Penalty, and Audience Splitting
In Highlight’s Penalty Analysis tool, non-JAR groups smaller than 15% are not given a penalty; in its worked example on a 9-point Overall Liking scale where 65% of respondents rated Flavor just about right (mean liking 8.0) and 20% rated it too much (mean liking 5.0), the Penalty is 8.0 − 5.0 = 3.0 and the Weighted Penalty is 3.0 × 0.20 = 0.60, exceeding the 0.50 Critical Risk threshold while at 14% rather than 20% no penalty is calculated.
Worked Example: 200-Respondent Snack Evaluation (Sweetness vs. Spice)
In Hercules’s illustrative penalty analysis of 200 people rating a snack on a 9-point scale, Sweetness is rated JAR by 124 respondents (62%, mean liking 7.4), too little by 36 respondents (18%, mean liking 6.2, drop 1.2, penalty 0.216), and too much by 40 respondents (20%, mean liking 5.6, drop 1.8, penalty 0.360). In the same snack example, Spice is rated JAR by 138 respondents (69%, mean liking 7.3), too little by 12 respondents (6%, mean liking 7.0, drop 0.3, penalty 0.018), and too much by 50 respondents (25%, mean liking 5.9, drop 1.4, penalty 0.350), giving a total Spice penalty of 0.018 + 0.350 = 0.368. When the two non-JAR Sweetness groups (36 too little with mean liking 6.2 and 40 too much with mean liking 5.6) are pooled into 76 not-right respondents, their average liking is (36 × 6.2 + 40 × 5.6) ÷ 76 = 5.88, giving a pooled drop of 7.4 − 5.88 = 1.52 and the same total penalty of 1.52 × 0.38 = 0.576 (0.216 + 0.360), which hides that sweetness splits in two opposite directions where adding sweetness helps the 36 and hurts the 40.
| Attribute and Direction | Respondents | Share | Mean Liking | Mean Drop | Weighted Penalty |
|---|---|---|---|---|---|
| Sweetness: JAR | 124 | 62% | 7.4 | n/a | n/a (reference group across 200 people on a 9-point scale). |
| Sweetness: too little | 36 | 18% | 6.2 | 1.2 | 0.216 (below 20% cutoff; opposite-direction split). |
| Sweetness: too much | 40 | 20% | 5.6 | 1.8 | 0.360 (meets 20% share with 1.8 drop). |
| Sweetness: pooled not-right | 76 | 0.38 | 5.88 | 1.52 | 0.576 (0.216 + 0.360; pooling hides that adding sweetness helps 36 and hurts 40). |
| Spice: JAR | 138 | 69% | 7.3 | n/a | n/a (reference group for Spice). |
| Spice: too little | 12 | 6% | 7.0 | 0.3 | 0.018 (negligible 6% share). |
| Spice: too much | 50 | 25% | 5.9 | 1.4 | 0.350 (clear one-sided reformulation target; total Spice penalty 0.018 + 0.350 = 0.368). |
Reading the Four-Quadrant Mean Drop (Penalty) Plot
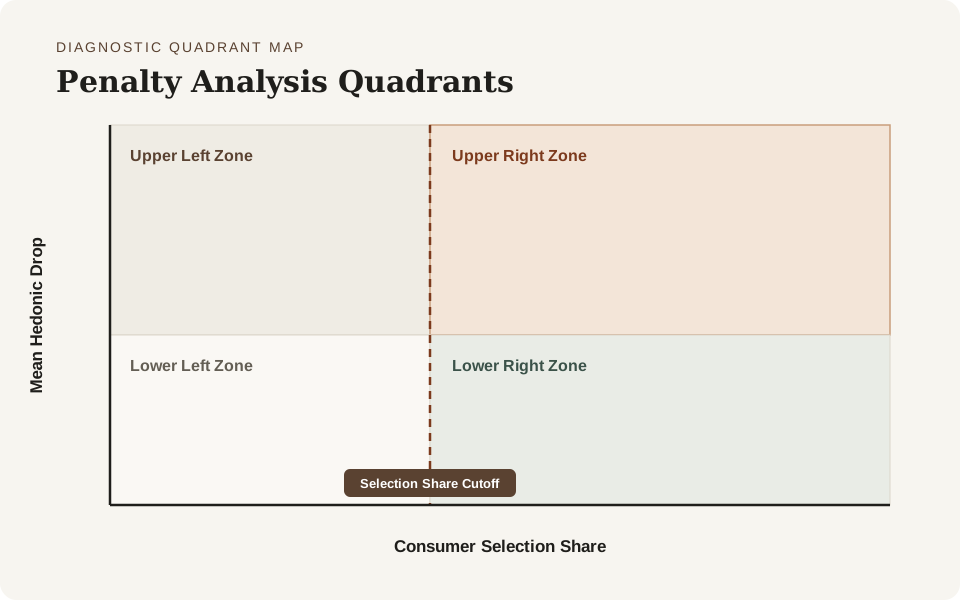
On a mean drop plot, the vertical dashed line at 20% of the x-axis (Selection) represents the typical industry skew cut-off percentage; if the number of responses in a non-JAR category is below the 20% threshold, penalisations are not taken into account because the percentage of responses is too small and might not be reliable, whereas attributes in the upper right quadrant (critical corner) require the most adjustment. In penalty analysis of JAR responses paired with overall liking scores, a deviation from the JAR level is considered relevant when it involves at least 20% of consumers and is associated with a mean drop in overall liking greater than 1 liking point. According to Popper (2014), a significant impact on overall liking in supportive penalty analysis is considered if more than 20% of consumers deviate from ‘just about right’ in their rating and cause a mean drop in the rating of more than 1 point. In the Belgian waffle consumer study, a penalty was considered concerning when the percentage of consumers selecting non-JAR responses was higher than 20% and the mean drop was greater than or equal to 2.0.
Empirical Case Studies: Why High Non-JAR Frequencies Do Not Always Penalize Liking
Carasau Breads Formulated with Wheat Co-Products
In baker’s yeast carasau breads formulated with powdered wheat co-products, DWB-P had high JAR proportions for roughness (72.58%) and hardness (66.13%) while toasted intensity and thickness were perceived as too low by 40.32% and 33.87% of consumers respectively, and WWG-P had roughness and thickness perceived as too high by 29.03% and 32.26% of consumers respectively, demonstrating that raw JAR response frequencies identify common deviations from ideal but do not establish whether they are associated with reduced overall liking. When penalty analysis (at least 20% of consumers and greater than 1 liking point mean drop) was applied to the baker’s yeast carasau breads, no deviation identified for DWB-P or WM-P exceeded both predefined thresholds, whereas DWG-P had relevant penalties for excessive hardness and thickness (approximately 24–26% of consumers, mean drops of about 2.3 and 2.1 liking points) and WWG-P had a relevant penalty only for insufficient toasted intensity (approximately 26% of consumers, mean drop of about 1.4 points). In sourdough-fermented carasau breads, WWG-F hardness generated non-JAR responses in both directions (29.03% too low and 41.94% too high, with 29.03% JAR and 40.32% JAR for toasted intensity), while WM-F exhibited relevant penalties across excessive roughness, hardness, toasted intensity, and thickness, all involving more than 20% of consumers with mean drops of approximately 2.7–3.1 liking points.
High-Fiber Belgian Waffles, Meatballs, and Milk Processing
In the high-fiber Belgian waffle study, 45.24% of consumers rated treatment W15 as ‘Too chewy’, resulting in mean drops of 2.08 for overall liking before health claim (OLB) and 2.01 for texture liking; in treatment W10, 22.22% of consumers rated it as ‘Too chewy’ with mean drops of 2.59 for OLB and 2.97 for texture liking, while 60.32% still rated W10 within the JAR range. In the high-fiber Belgian waffle study, 53.97% of consumers rated brown-color as ‘Not enough’ on the JAR scale for treatment W15.
For deeper background on how structural mechanics shape consumer ratings, compare our analysis of texture and expectation in food perception.
In the university dining hall meatball study, insufficient savoriness (‘not enough’) was penalized across both plant- and animal-based meatballs, with tastiness penalties ranging from 0.71 for Soy-Wheat to 1.36 for Beef. In the milk sensory evaluation study, high pressure processed (HPP) milk had a darker colour (lightness L-value 90.8 versus 92.7 for ESL milk) but a lower colour penalty of 0.439 (lower by 0.712) compared with 1.151 for ESL milk, while approximately 29% of panellists perceived HPP milk aftertaste as too weak.
Methodological Risks, Cognitive Biases, and Questionnaire Task Order
In Epler, Chambers and Kemp (1998), consumers evaluating five lemonades differing in added sugar yielded an optimal sugar concentration of about 9.5 percent on the JAR scale versus about 10.5 percent on the overall liking scale, and a separate group of consumers in a preference test preferred the formulation optimized on liking over the one optimized on the JAR scale. In Popper, Chaiton and Ennis (1995), optimizing the level of aspartame in a fruit drink on the basis of a JAR scale for sweetness predicted an optimal level of aspartame 20 percent lower than that predicted on the basis of overall liking. JAR scales can induce directional response biases: attributes with negative health or sensory connotations (such as sweetness perceived as unhealthful, or bitterness in coffee) skew toward ‘too sweet’ or ‘too much’ even when that level contributes positively to overall liking, whereas desirable attributes (such as ‘fresh orange flavor’ in orange juice, chocolate chips in a cookie, or cheese on a pizza) skew toward ‘not enough’ even when liking decreases above a certain level.
Raw JAR percentages do not specify how much formulation adjustment is required because JAR scale sensitivity to formulation changes differs by attribute (Moskowitz, 2004), raising an attribute level can alienate respondents who currently view it as just right, attributes interact with one another, and consumers may be more tolerant of deviations in one attribute (such as flavor level) than in another (such as sweetness). Penalty analysis should be interpreted as a diagnostic rather than a causal tool because mean drops describe associations between non-JAR responses and liking among consumers selecting a particular category and do not demonstrate that modifying an individual attribute would necessarily produce a corresponding increase in acceptance.
Protecting Overall Liking from JAR Question-Order Bias
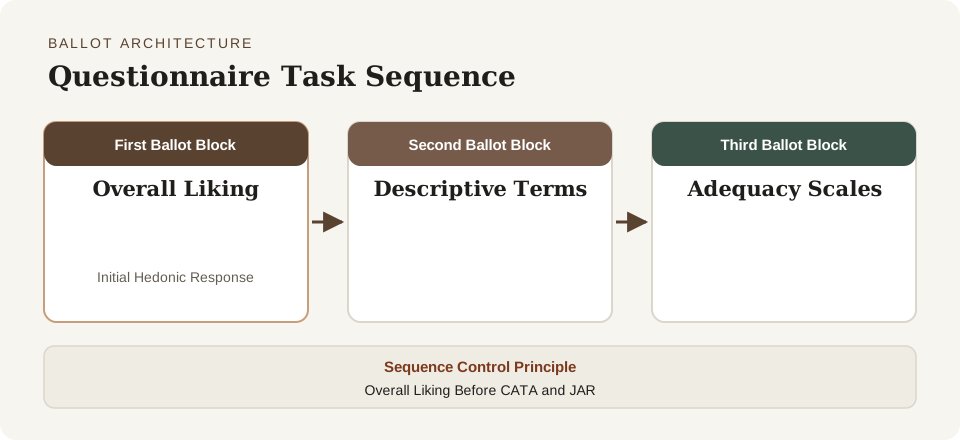
In a study by Popper and colleagues (2004), respondents who rated their overall liking for four dairy desserts and also rated the products on a series of JAR scales (such as sweetness, thickness, and flavor intensity) rated their overall liking of the products differently than respondents who rated only overall liking. Popper and colleagues (2004) found that intensity scales (rating sensory intensity from low to high) did not have the same biasing effects on overall liking as JAR scales, because answering JAR questions requires respondents to consider how products differ from an ideal, focusing them on reasons why they like or dislike a product. In the carasau bread consumer study, overall liking was assessed first, followed by descriptive (CATA) and attribute-adequacy (JAR) tasks, to obtain an initial hedonic response before directing participants’ attention toward specific sensory characteristics.
Serving Controls and Trained Descriptive Panel Alternatives
In the reduced-sodium vegetable broth study, broth samples were served in 30 mL portions at approximately 50 °C under blind, randomized, and balanced presentation order to 282 consumer panelists, who evaluated 9-point hedonic overall liking, 5-point JAR saltiness, and 0–10 Rate-All-That-Apply (RATA) attribute intensity. On The Censes’s sensory test design guide, the Australian Wine Research Institute’s wine-tasting checklist specifies blind randomized presentation, at least two tasters for quality-control checks, 30 mL pours at about 20°C in covered glasses coded with three-digit random numbers, a maximum of six to seven wines per session, and establishing a difference before judging preference. On The Censes’s descriptive sensory analysis panel guide, trained descriptive panels use non-hedonic, singular, and non-redundant lexicon terms, reference standards with assigned intensity scores (e.g. 0–15 in the cookie study or 1–15 in the World Coffee Research lexicon); ISO 4121:2003 describes quantitative response scales; and performance checks for product discrimination, agreement, and repeatability.
When a formulation change is small enough that you first need to verify whether assessors can perceive any difference at all before running consumer hedonic and JAR diagnostics, use our triangle test sensory evaluation protocol.
JAR Scale Distribution and Penalty Analysis Calculation Worksheet
Record your consumer panel counts, collapsed subgroup shares, and subgroup liking averages in this worksheet to compute directional mean drops and weighted penalties for each attribute.
| Worksheet Field | Too Low Subgroup | Just-About-Right (JAR) Subgroup | Too High Subgroup | Formula and Action Rule |
|---|---|---|---|---|
| 5-point scale score mapping | Scores 1–2 ('much too low' and 'slightly too low') | Score 3 ('just-about-right') | Scores 4–5 ('slightly too high' and 'much too high') | Collapse the 5-point JAR scale into 3 groups before computing proportions. |
| Subgroup respondent share | JAR(NE%) = N of JAR's(NE) / Total JAR's N | Reference JAR share | JAR(TM%) = N of JAR's(TM) / Total JAR's N | Check whether JAR(NE%) >= 20% or JAR(TM%) >= 20% before reporting a penalty. |
| Directional Mean Drop | [mean liking score of the JAR group—mean liking score of the too low group] | Reference baseline | [mean liking score of the JAR group—mean liking score of the too high group] | Keep both directions separate rather than pooling non-JAR respondents. |
| Weighted Penalty (Total Penalty Score) | p(non-JAR) × mean drop for too low | n/a | p(non-JAR) × mean drop for too high | Use weighted penalty as a descriptive prioritization index across attributes. |
| Relevance and Reformulation Gate | At least 20% of consumers and mean drop greater than 1 liking point | n/a | At least 20% of consumers and mean drop greater than 1 liking point | Prioritize upper-right critical corner attributes. |
Sources
- CRAN / R Project — SensoMineR Package Reference: JAR and plot.JAR.
- Europe PMC / Foods — Consumer Acceptance and Penalty Analysis of High Pressure Processed Milk.
- Europe PMC / Foods — Sensory Perception and Saltiness Adequacy in Reduced-Sodium Vegetable Broth.
- SIMS Sensory Software — Penalty Analysis Technical Documentation.
- Quirk’s Marketing Research Review — Just-About-Right Scales in Product Evaluation.
- Europe PMC / Foods — Sensory Profiling, CATA, and JAR Penalty Analysis of Carasau Breads.
- Europe PMC / Foods — Consumer Acceptability and Penalty Analysis of High-Fiber Belgian Waffles.
- Europe PMC / Food Science & Nutrition — Supportive Penalty Analysis in Consumer Sensory Evaluation.
- Europe PMC / Food Research International — Consumer Evaluation and JAR Penalty Analysis of Plant- and Animal-Based Meatballs.
- ASTM International — Just-About-Right (JAR) Scales: Design, Usage, Benefits and Risks.